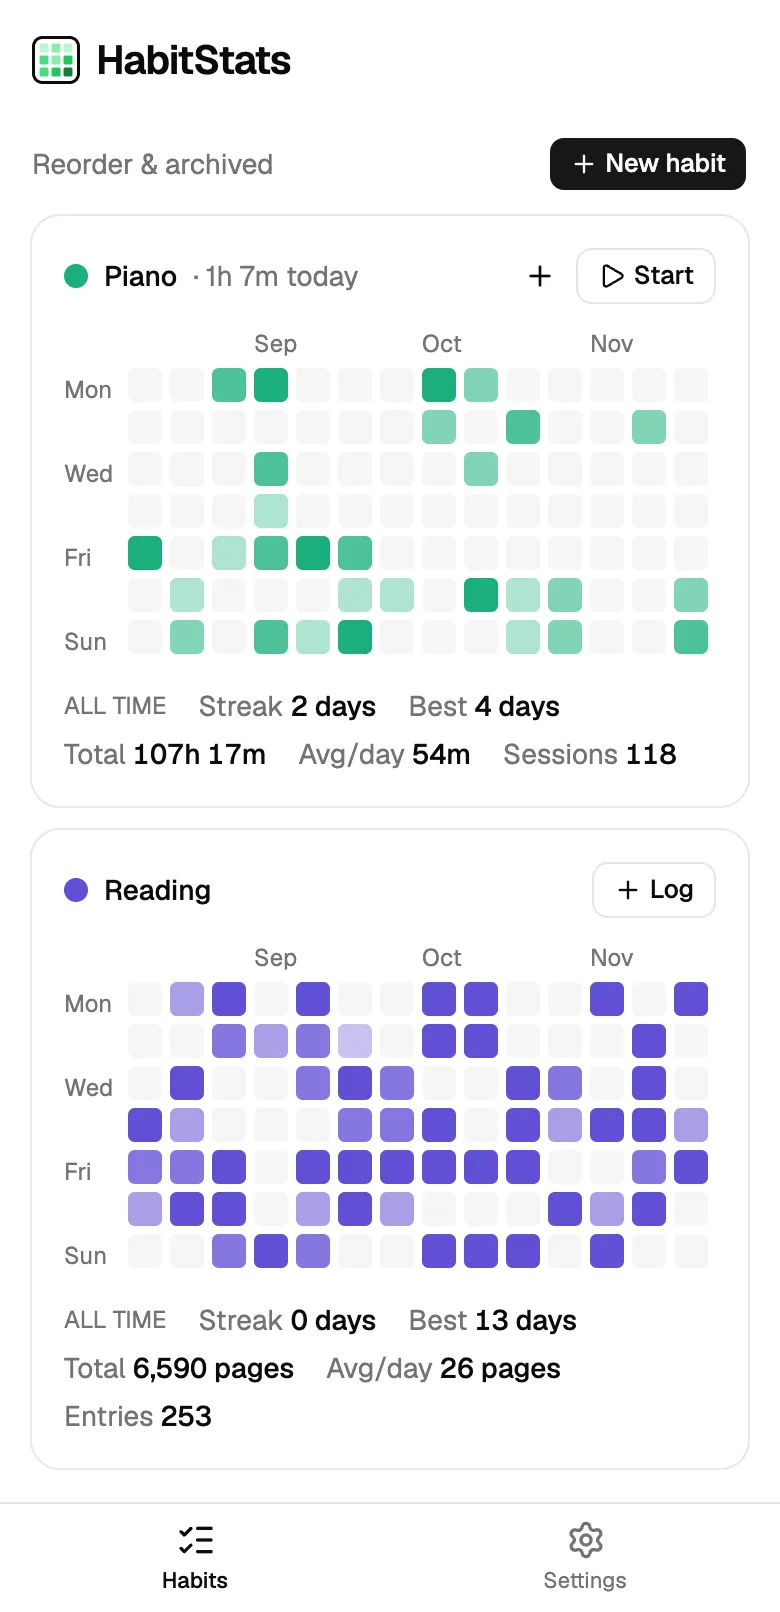
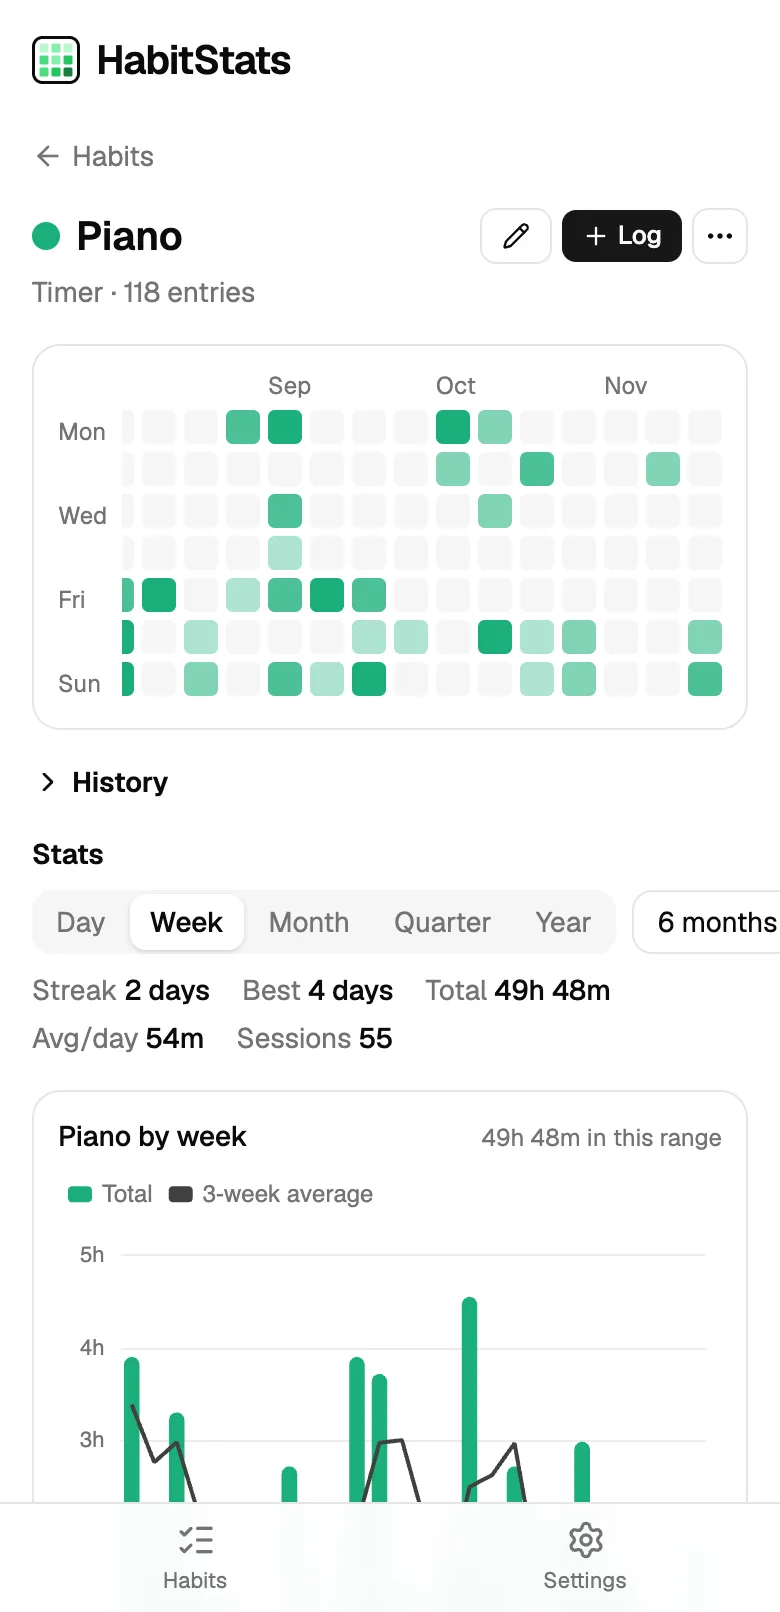
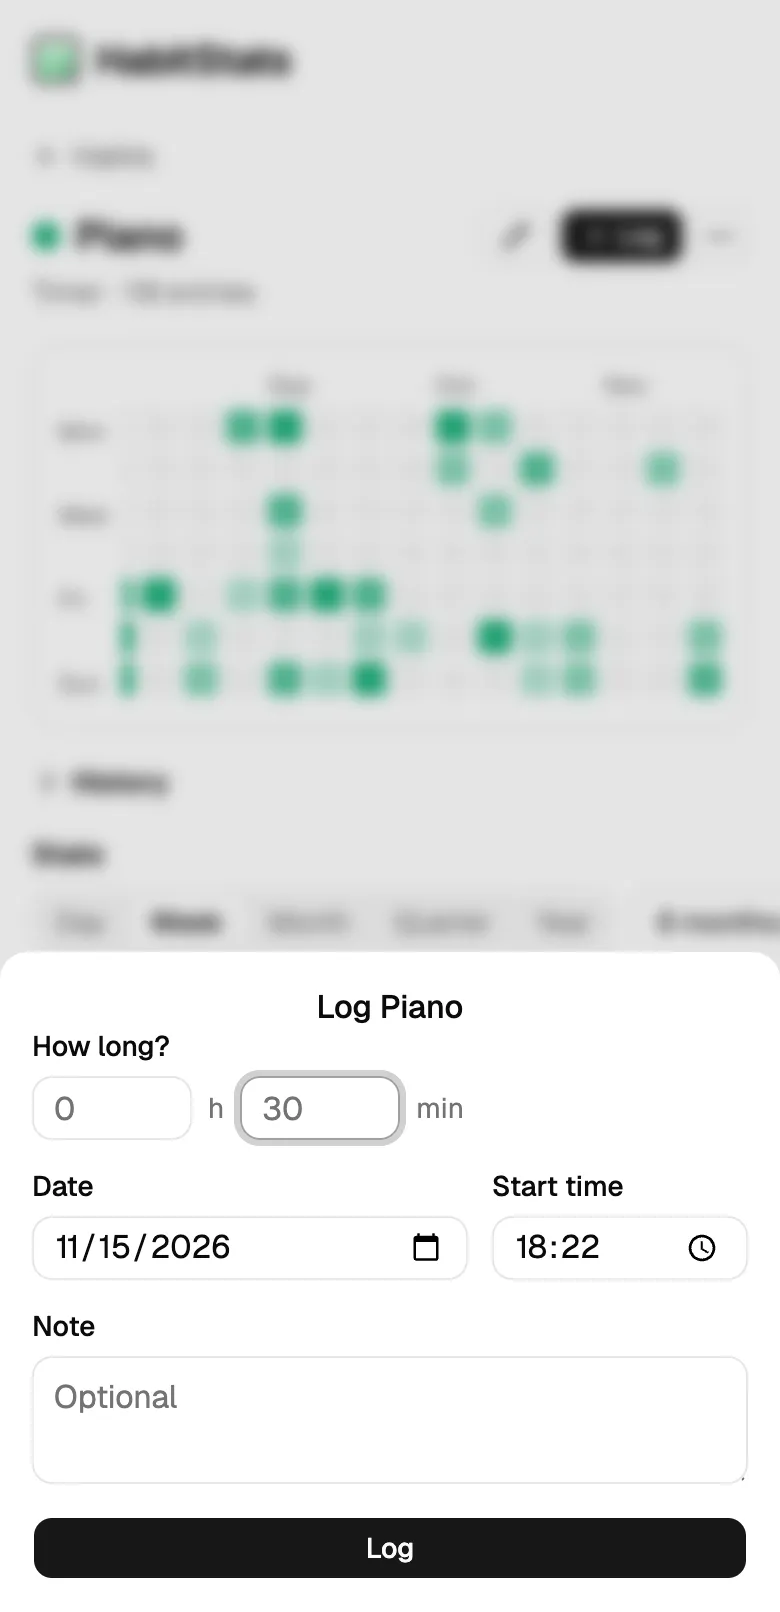
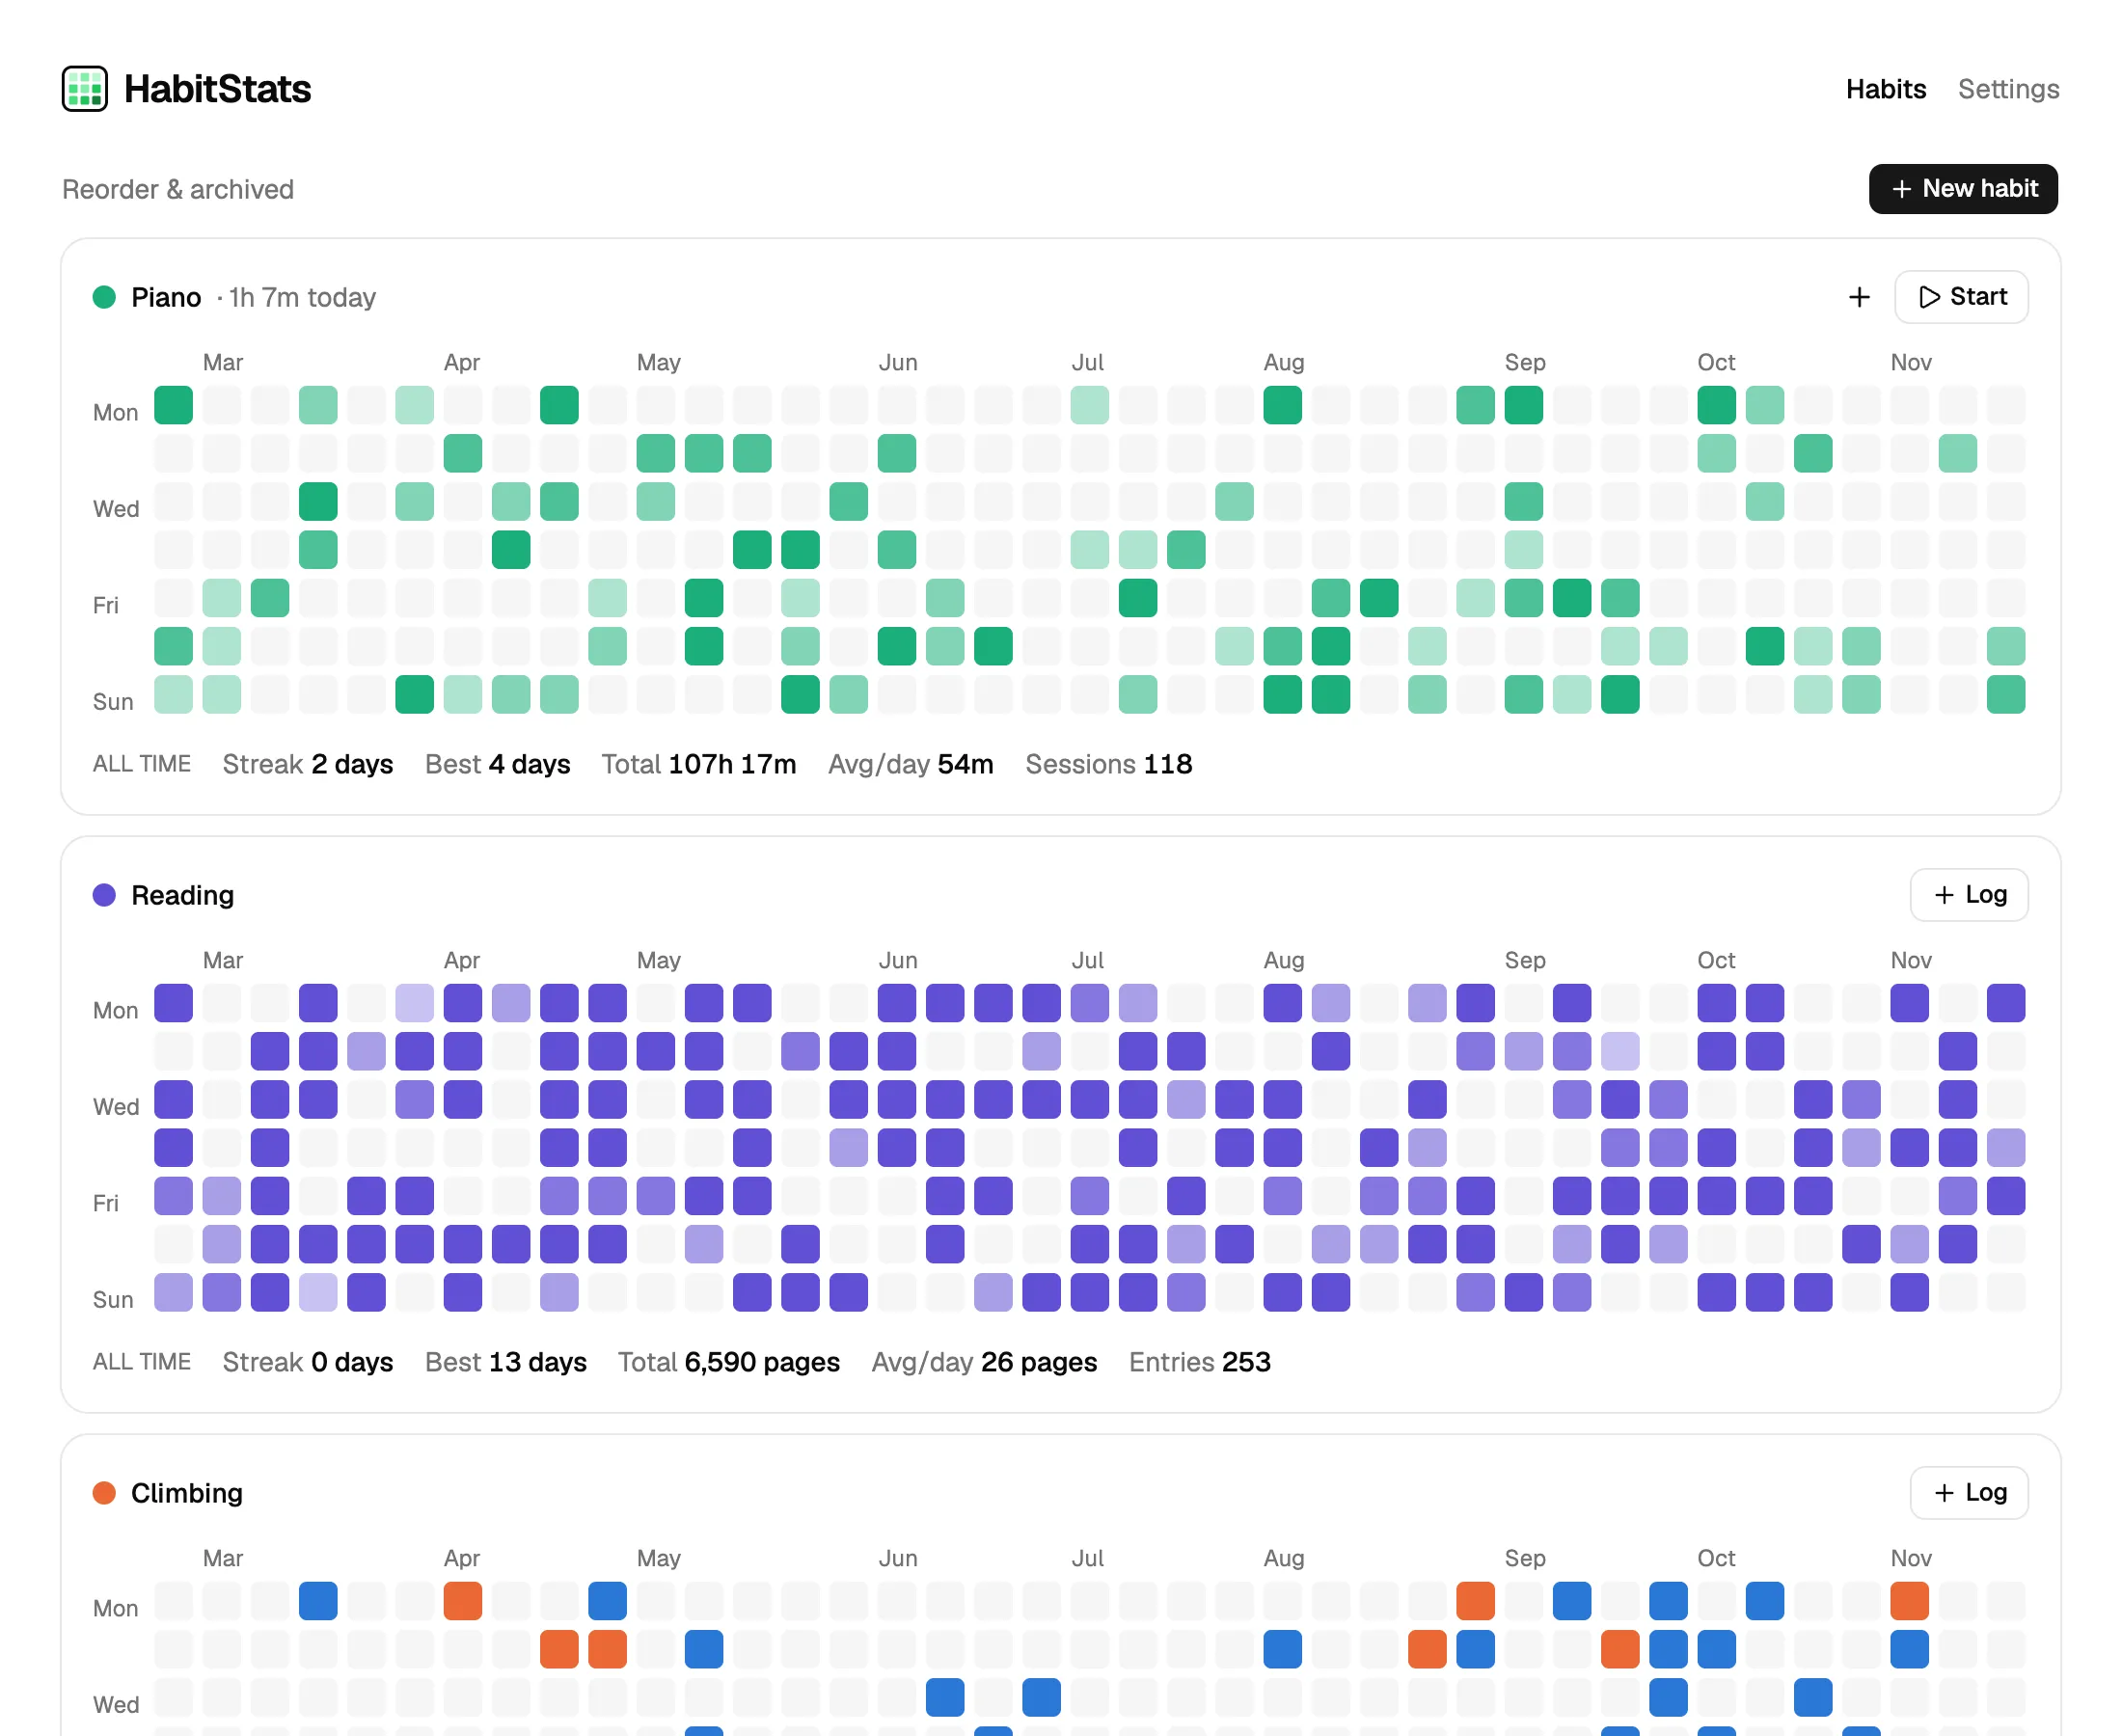
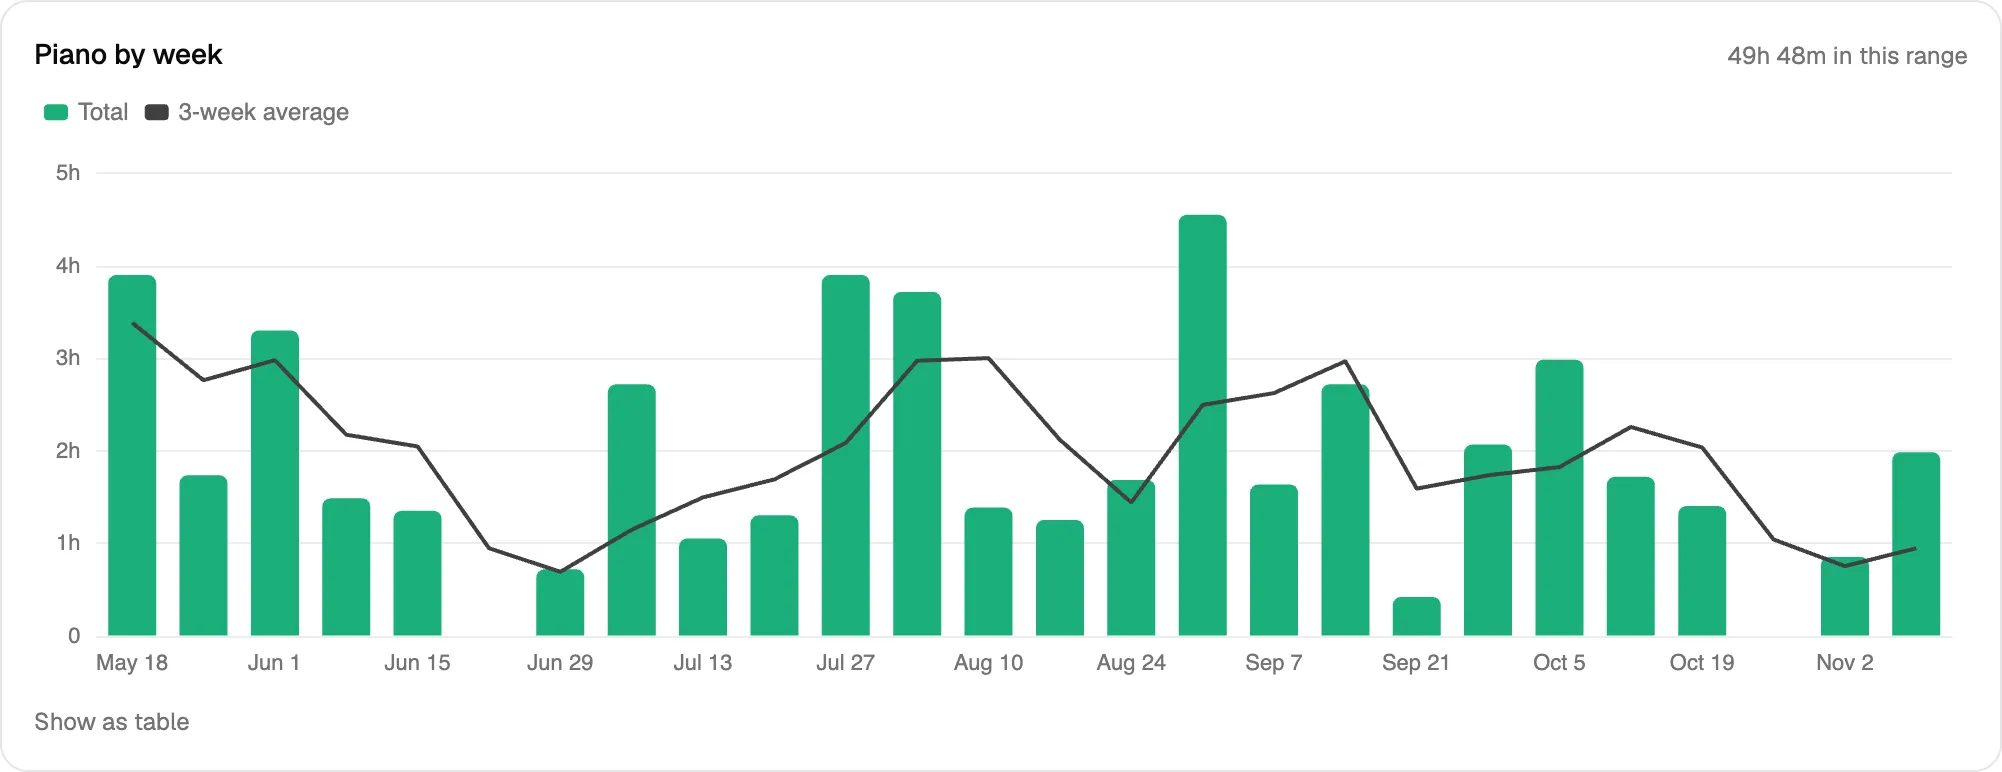
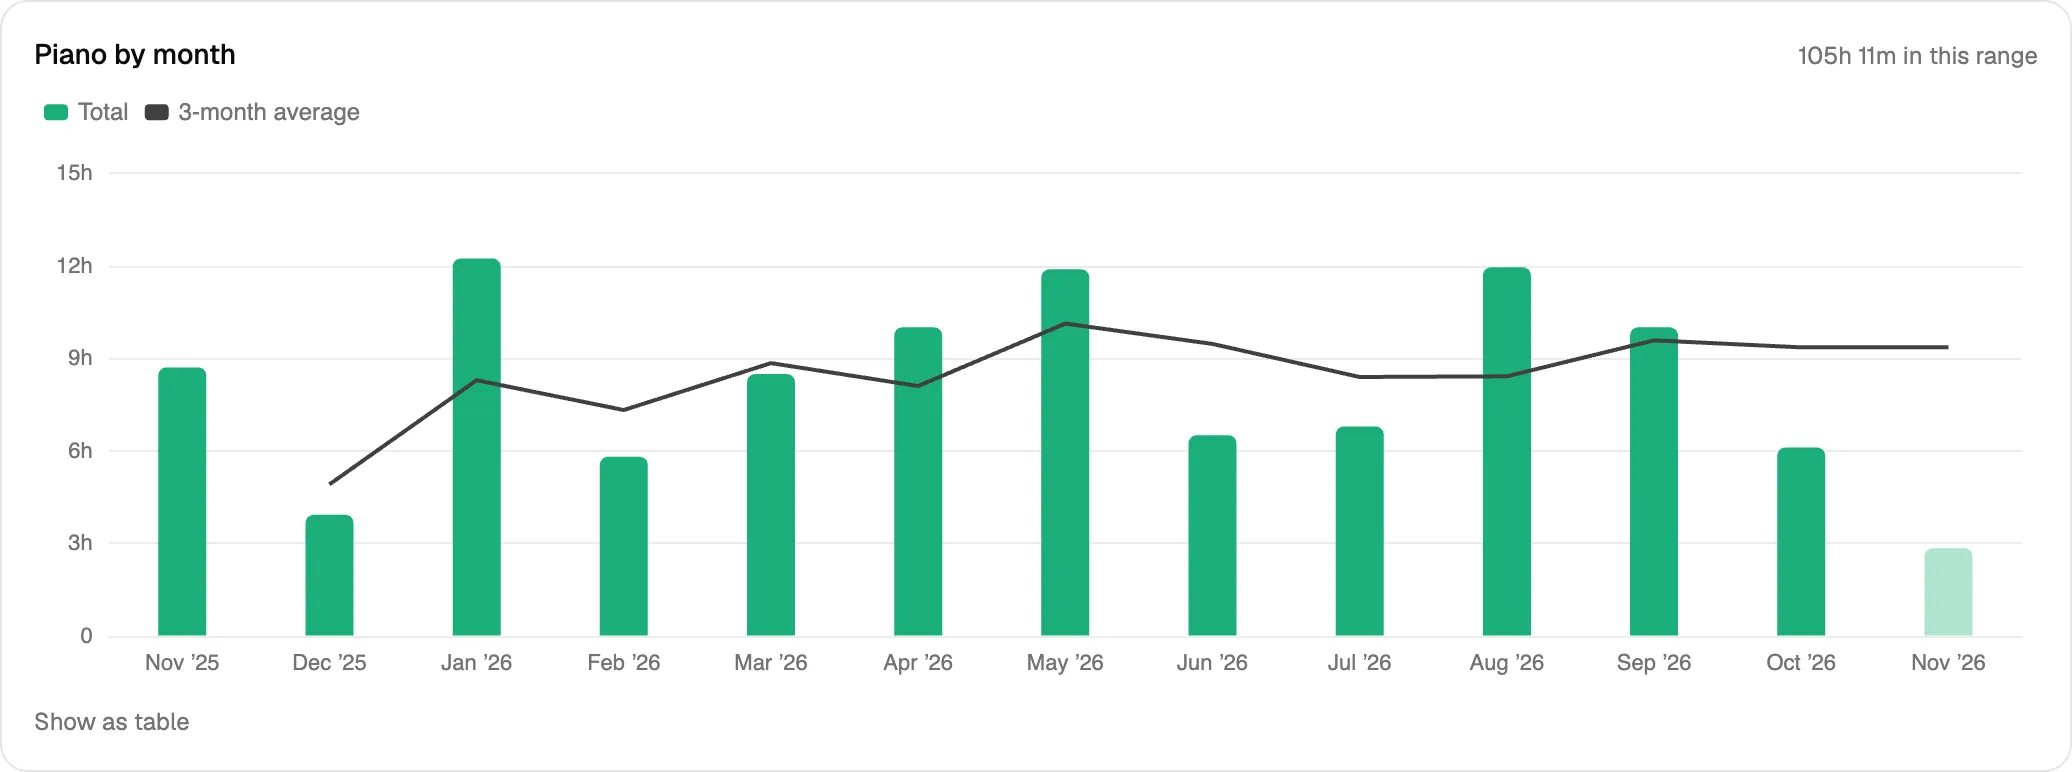
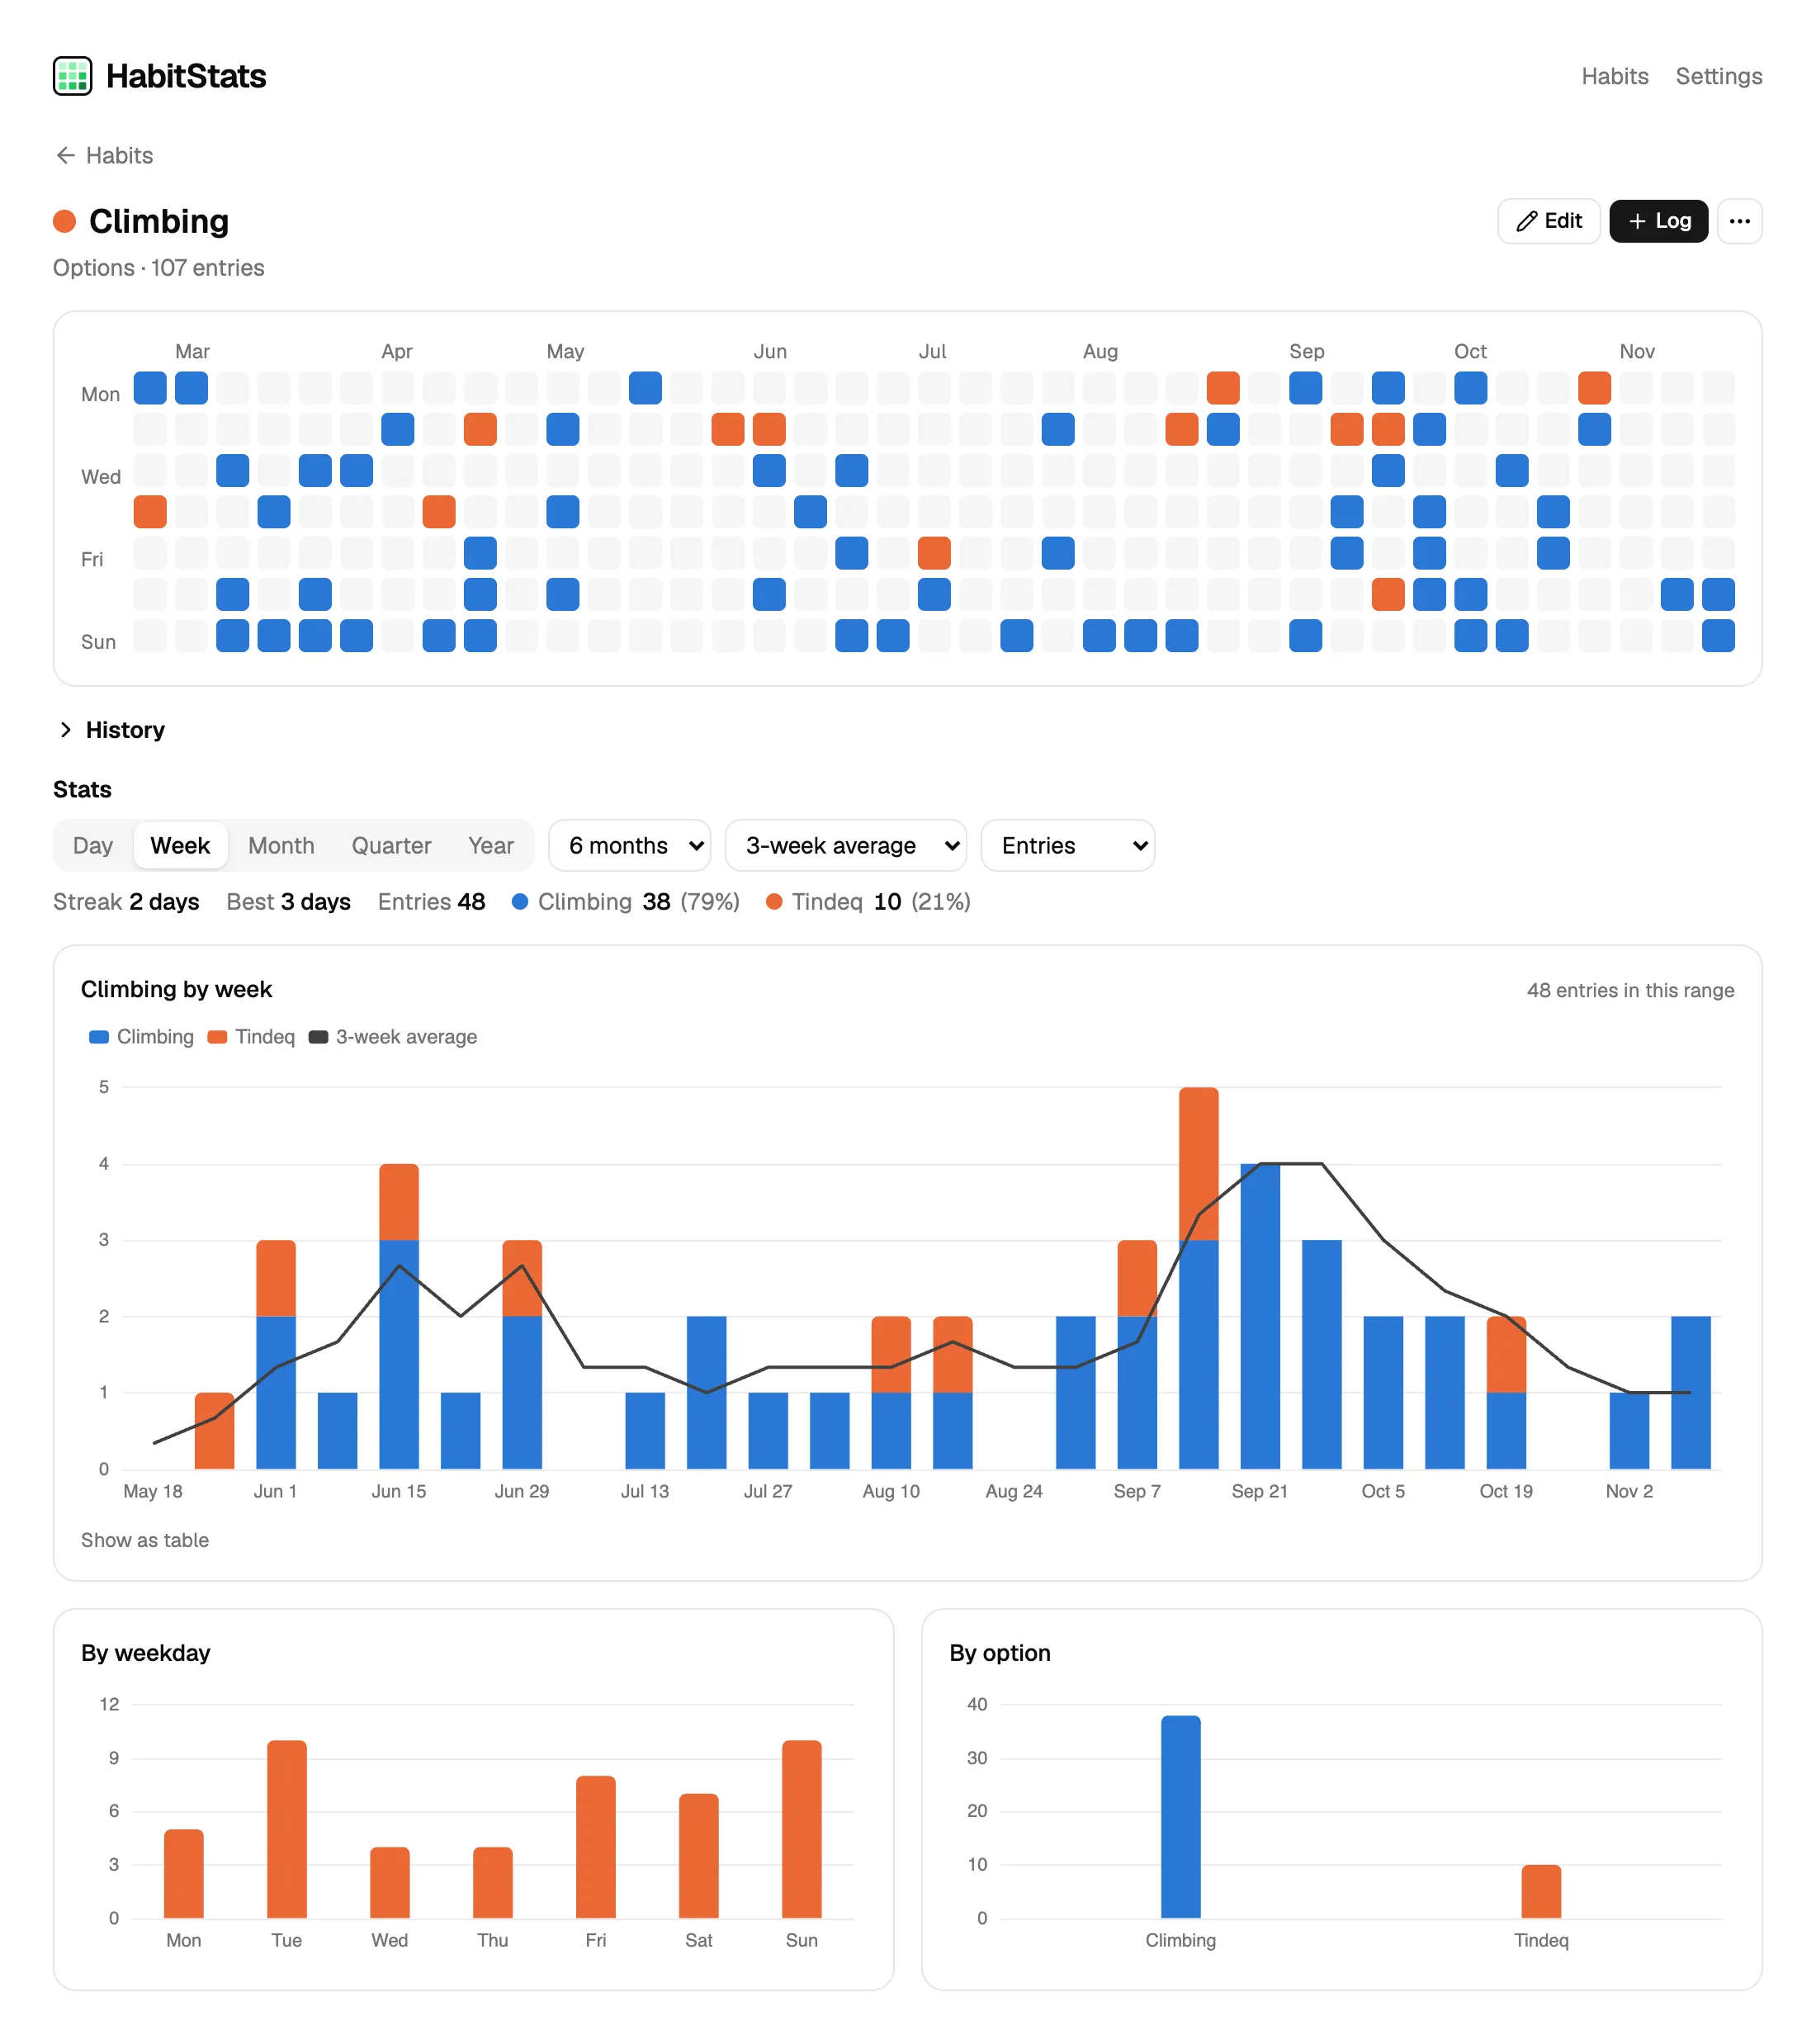
On your phone. Your habits as heatmaps, each habit's page, and logging a timer habit by hand.The overview. On a bigger screen the heatmaps go back further. Tap a day to log or edit it.By week, with a 3-week rolling average to show the trend.By month. The current month is drawn lighter: it's partial, and compared with the same point last month rather than a full one.
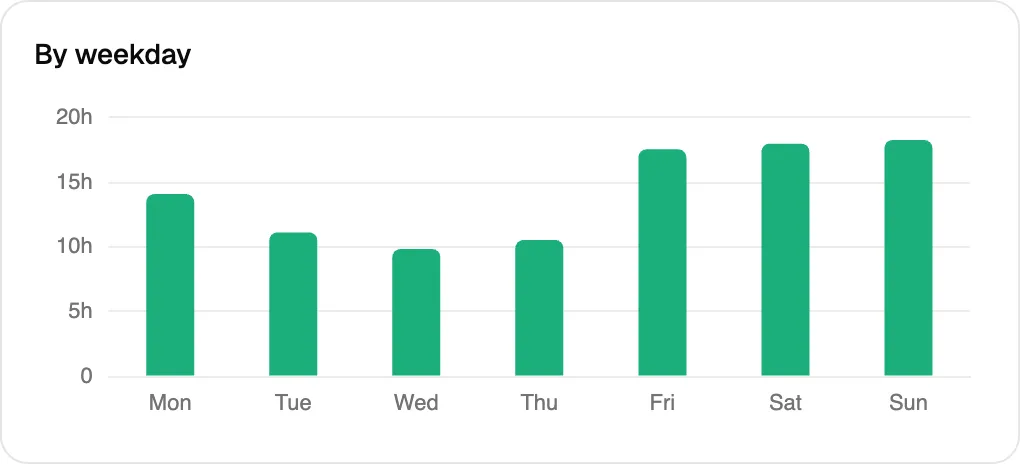
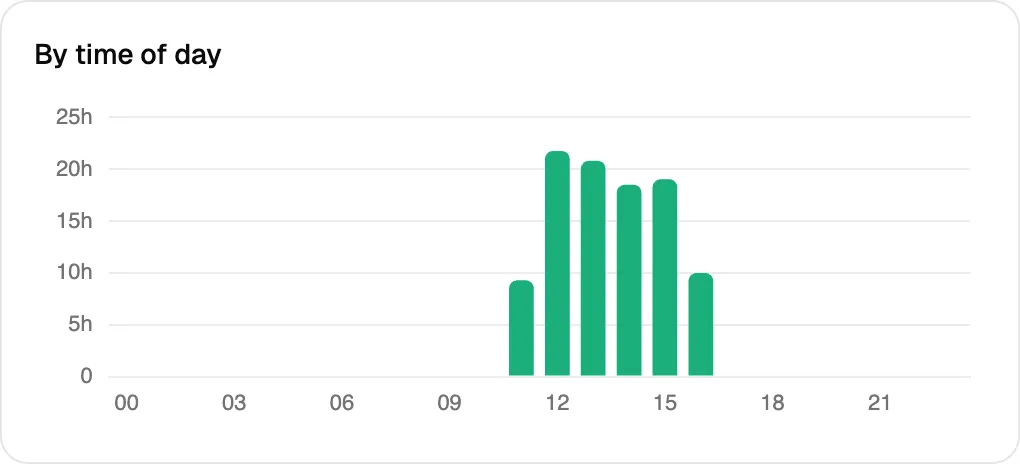
Breakdowns by weekday and by time of day, over the same range as the chart.An options habit. Each option has its own colour in the heatmap and the charts, and its own share of the total.
 HabitStats