 HabitStats
- Try HabitStats without signing up: "Try the demo" opens a read-only account with sample habits.
Habit tracker
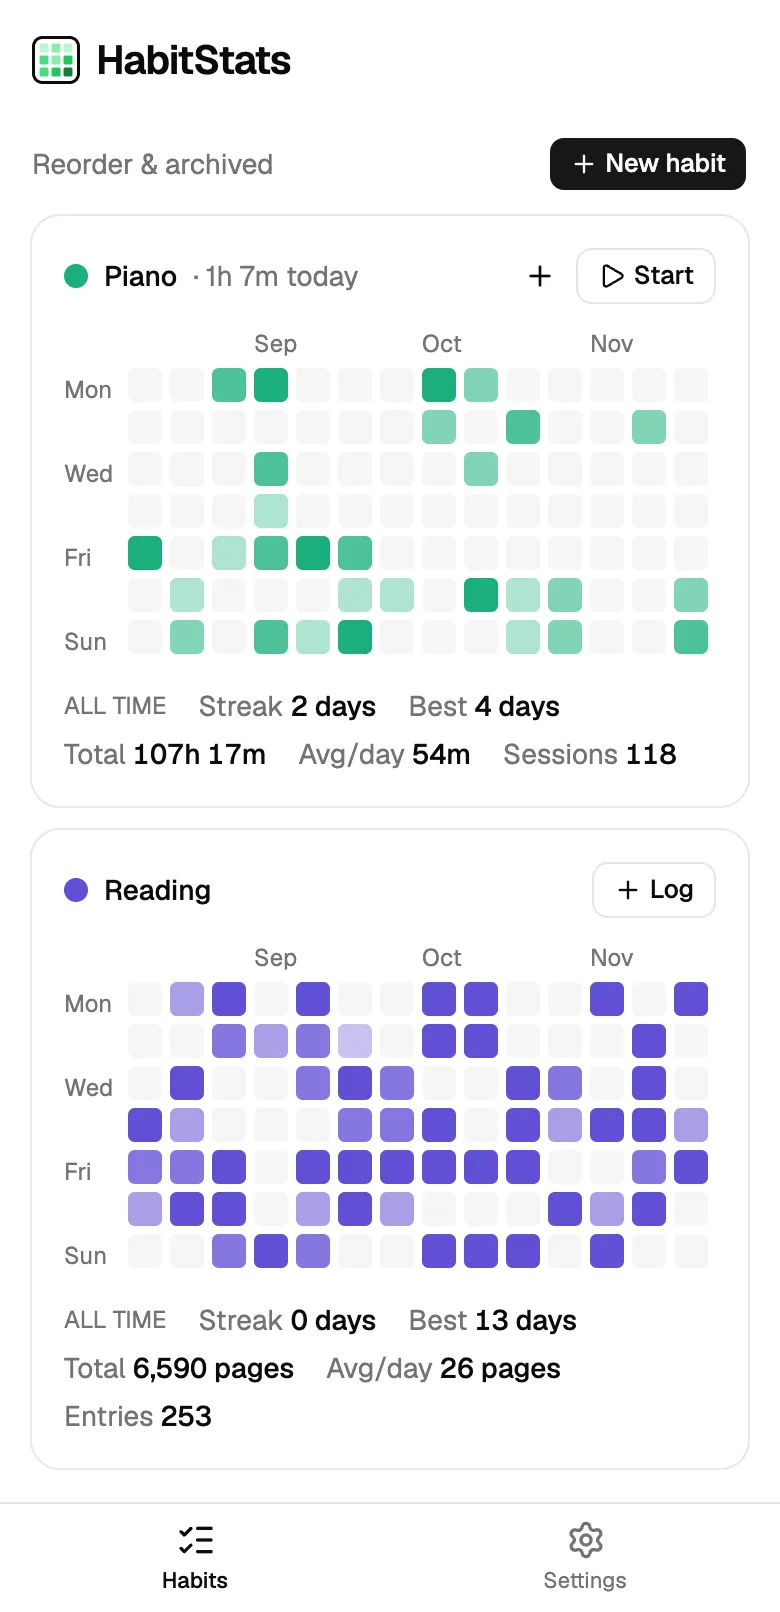
Simple and free, accessible on any device with robust analytics. Log a habit in one tap, see your year as a heatmap, then dig into weekly and monthly trends. Your data is yours: import and export.
Simple and free
Log a habit in one tap and see your year at a glance. No ads, no trackers, no paid tier.
On any device
Phone, tablet or computer. It installs from the browser, so there is no app store and nothing to download.
How to install →Robust analytics
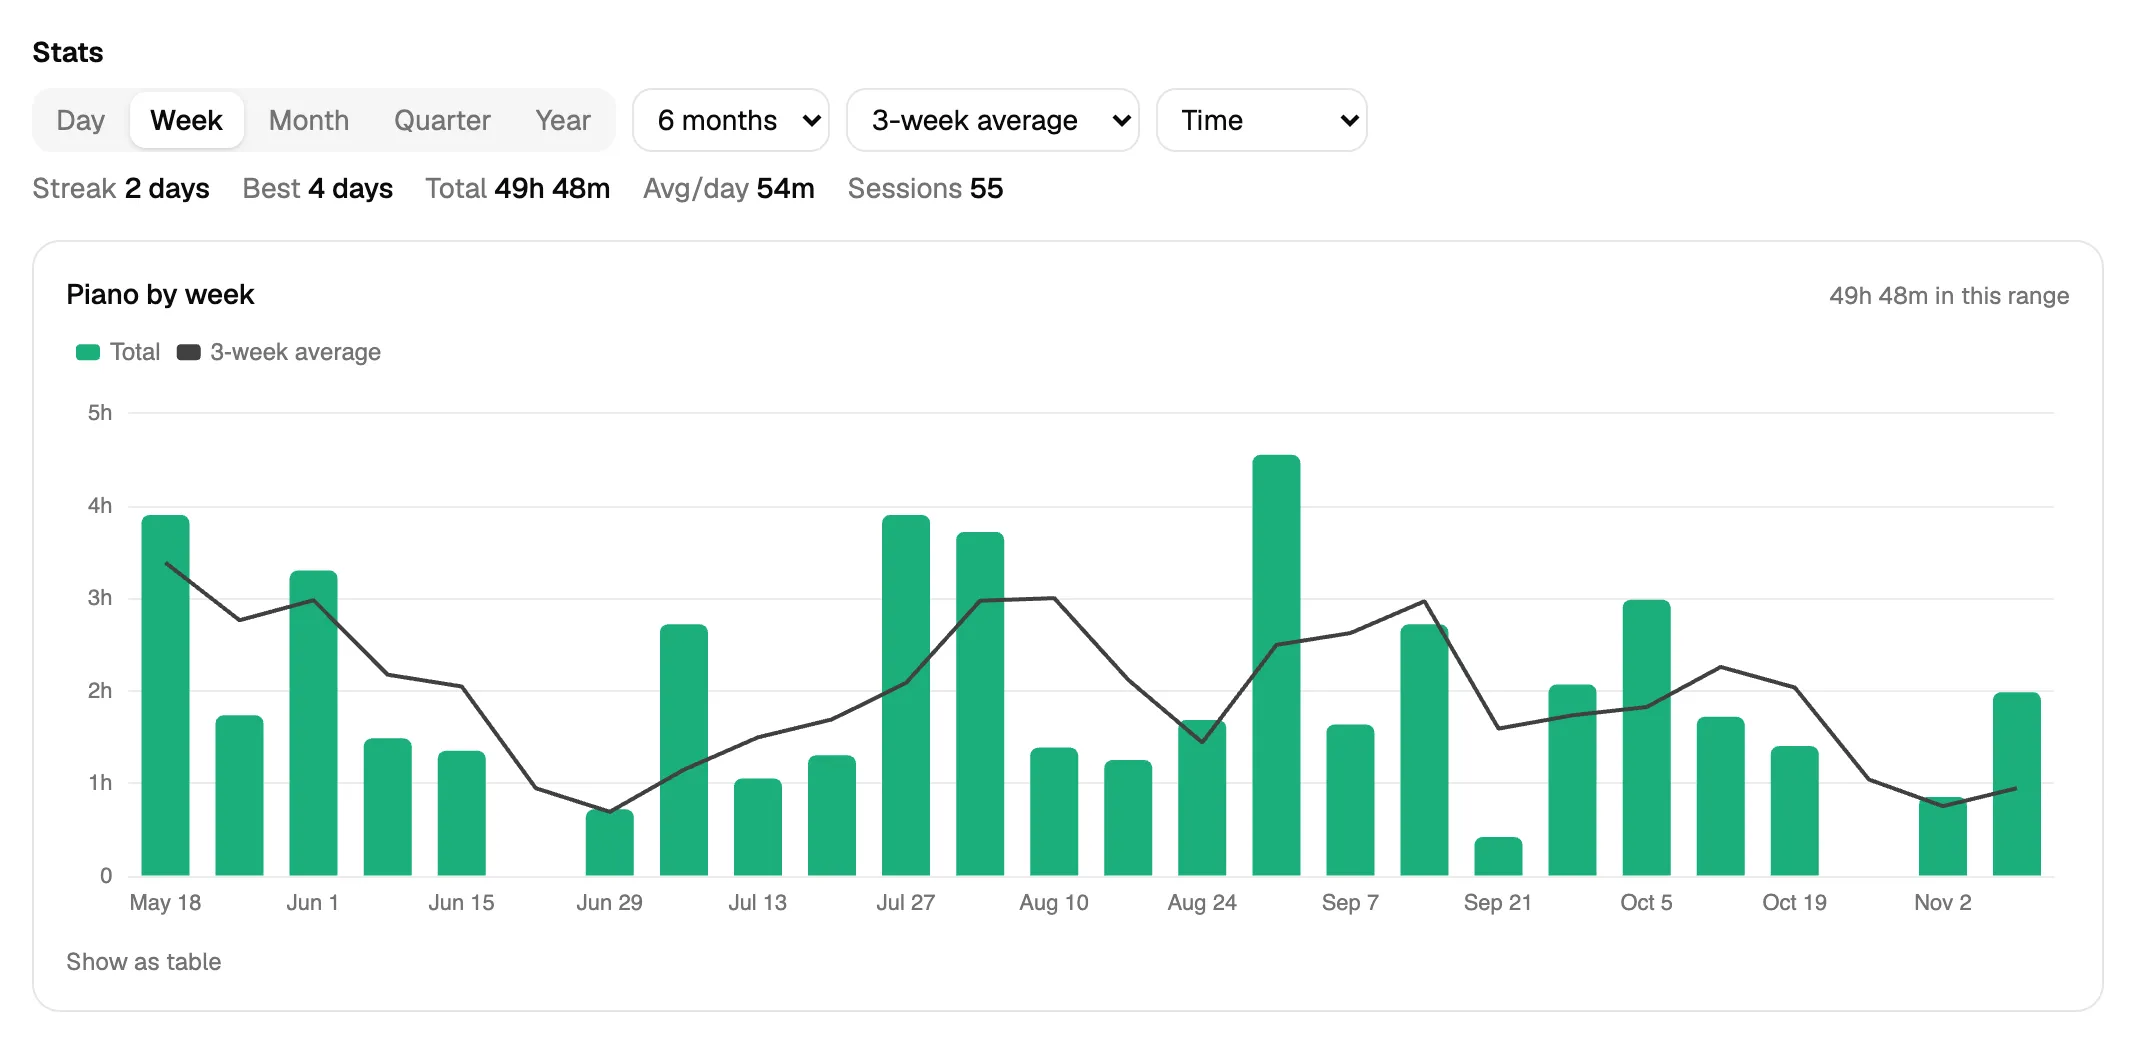
Totals by day, week, month, quarter or year, rolling averages, and breakdowns by weekday and time of day. The period you are in is compared with the same point last time, so a month that just started never looks like a slump.
See the screenshots →Import and export your data
Bring your history from HabitHeat, and get all of your habits and entries out through the API whenever you want.
Read the docs →MCP and API
A documented API with personal tokens, for scripts and Shortcuts. An MCP server, so AI assistants can log and read your habits, is next.
MCP and API →Four kinds of habit
Done or not, a number (pages, reps, glasses), a choice of options, or a timer you start and stop.